Opening Range Volume Profile
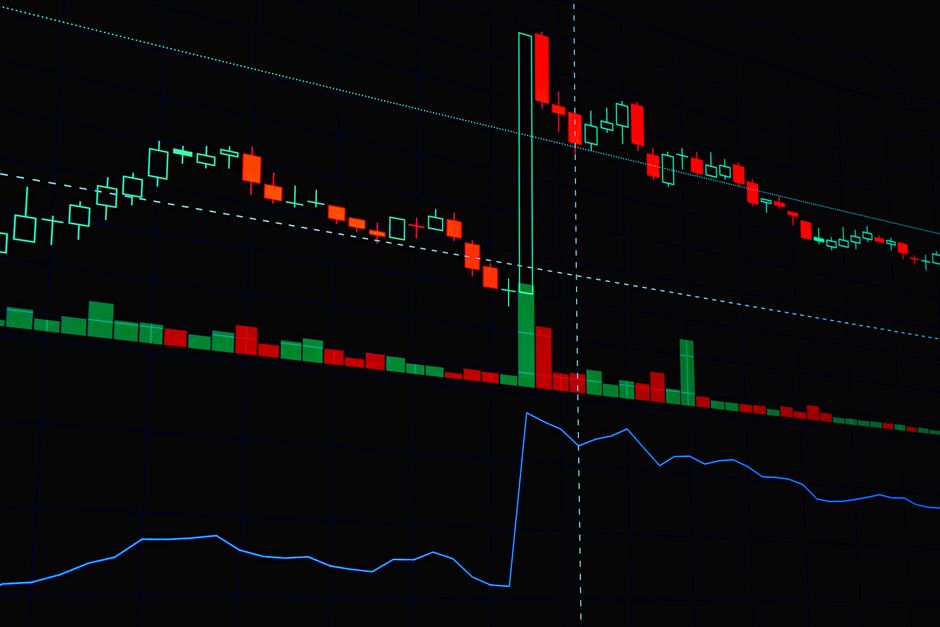
Volume settles into specific clusters at the market open. The data sets provided at orb trading nasdaq brandedvideo demonstrate how a fifteen minute range dictates the immediate intraday bias. Analyzing the opening range breakout requires looking past simple price levels to see where the actual contracts changed hands during the first fifteen minutes of regular trading hours.
High Volume Nodes and Value Areas

The opening bell triggers a massive influx of liquidity that often creates a false sense of direction. A standard price action approach looks at the high or the low of the candle. A volume profile approach looks at the high volume nodes. These nodes represent the price levels where the most aggressive participation occurs. When the price stays within a high volume node established during the first fifteen minutes, the market is in balance. A breakout from this specific zone suggests a shift in the intraday trend. Using a 15 minute timeframe allows for the identification of these clusters before the trend becomes overextended.
Identifying the True Value Area
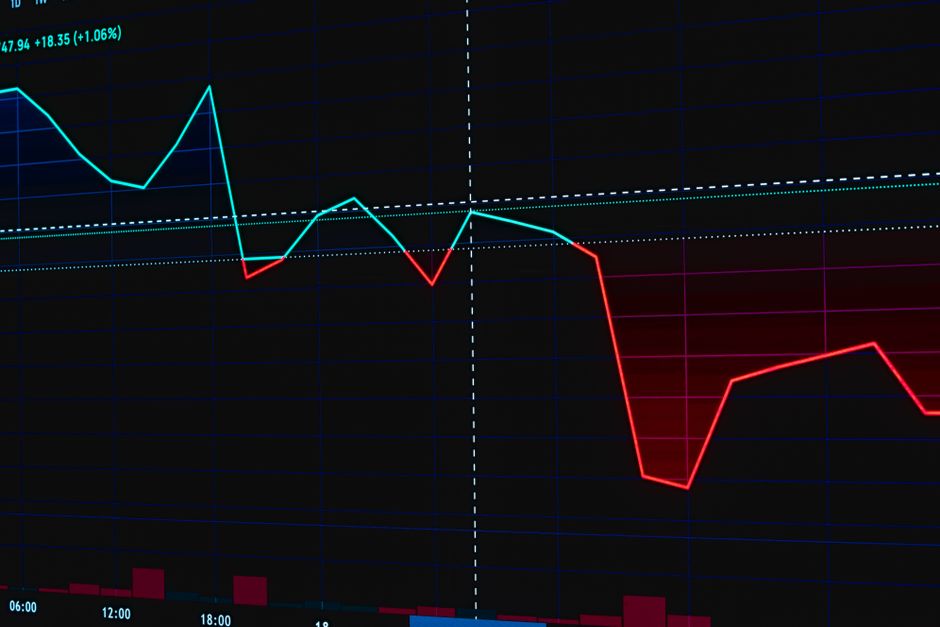
Value is not a fixed number. It is a distribution of activity. During the opening range, the volume profile reveals a bell curve of participation. The center of this curve is the point of control. If the price moves away from the point of control and then fails to reclaim it, the direction is confirmed. A failure to hold a high volume node often leads to a quick mean reversion toward the previous session high or low. The mechanics of the trade depend on the relationship between the current price and the volume clusters formed at the cash open.
Execution Mechanics and Timeframes
A 5 minute chart provides the entry detail, but the 15 minute range provides the structural context. Trading against a heavy volume node is a low probability move. If the price is hovering above a significant node, that node acts as a floor. If the price is below it, that node acts as a ceiling. The first hour of the session often establishes the boundaries for the rest of the day. Observing how the volume accumulates or thins out within these boundaries dictates the scale of the position. A thin volume area suggests high volatility and potential for a fast move.
Volume Profile vs. Price Action
Price moves can be deceptive during the first few minutes of the session. High volume nodes provide a mechanical way to filter noise. A price move through a high volume node without significant volume is often a trap. The profile shows where the real money is positioned. By mapping the fifteen minute range, the specific levels of support and resistance become objective rather than subjective. The work of identifying these levels relies on the math of the volume distribution rather than the appearance of the candles.