The False Breakout Trap

Many traders enter a position the moment a price candle breaches a level and ignore the price action returning to the origin. The data at orb trading nasdaq brandedvideo shows that an opening range breakout often fails because the candle fails to hold the new territory. This specific pattern of price movement occurs frequently during the first fifteen minutes of the session.
The Mechanics of the Wick
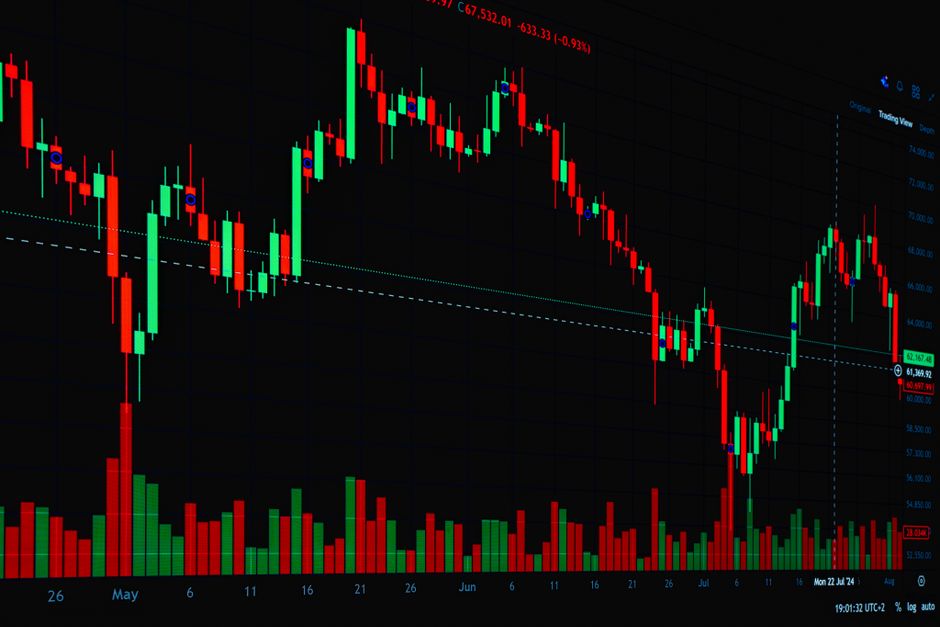
Price action frequently extends beyond the established boundaries of the five minute range only to retreat. This movement creates a long wick on the candle. A wick indicates that orders were present at the breakout level, but the liquidity was insufficient to sustain the trend. When the candle closes back inside the opening range, the failed move provides a signal of rejection. The high or low of that candle becomes a technical marker for the session high or session low. Relying on the breach alone leads to entering at the exact point where the momentum reverses.
Identifying Liquidity Traps

False breakouts often occur when the market open sees a sudden surge of retail orders hitting a single direction. These orders provide the fuel for a temporary spike. Once the larger institutional orders absorb this volume, the price snaps back. Observing the thirty minute range helps distinguish between a true trend and a momentary spike. A valid breakout requires a candle body to close outside the boundary. If the body remains inside the boundary, the move is a trap. This mechanical distinction separates a successful entry from a reversal trade.
Timeframe Selection and Execution
The choice of timeframe dictates the detection of these traps. Using a 5 minute chart allows for the identification of the wick before the candle closes. A 15 minute chart provides a broader view of the intraday trend but delays the realization of the failure. The first hour of regular trading hours is when these liquidity grabs are most prevalent. A trader watches the relationship between the candle close and the previous boundary. If the close is inside the range, the breakout is void. The mechanical execution depends on seeing the close, not the touch.
Volume and Rejection
High volume on a failed breakout confirms the presence of a liquidity grab. A spike in volume accompanied by a long wick suggests that the market has cleared out orders at the boundary. This process often leads to a fast move in the opposite direction. Watching the price action during the cash open provides the necessary context. The interaction between the opening bell and the subsequent price stabilization determines the direction for the rest of the session. A failed breakout at the start of the session often sets the tone for the entire day.