ORB Gap-and-Go Mechanics
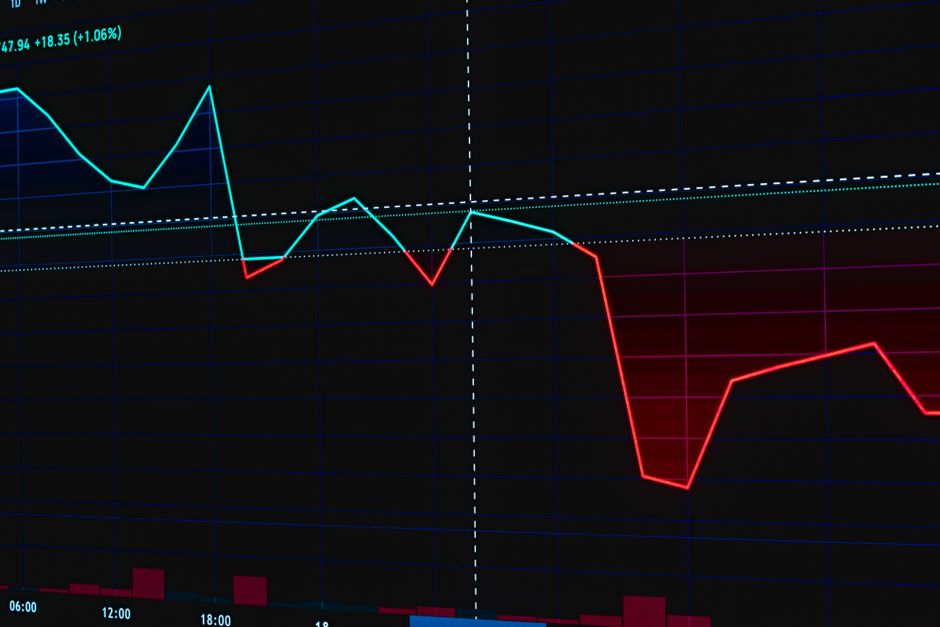
The market is expected to mean revert after a large gap. Frequently, the price simply continues in the direction of the impulse. Analysis at orb trading nasdaq brandedvideo demonstrates that a gap-and-go setup relies on the relationship between the premarket data and the opening range breakout. Large gaps often signal a shift in the overnight session sentiment that carries directly into the regular trading hours.
Gap Magnitude and Momentum
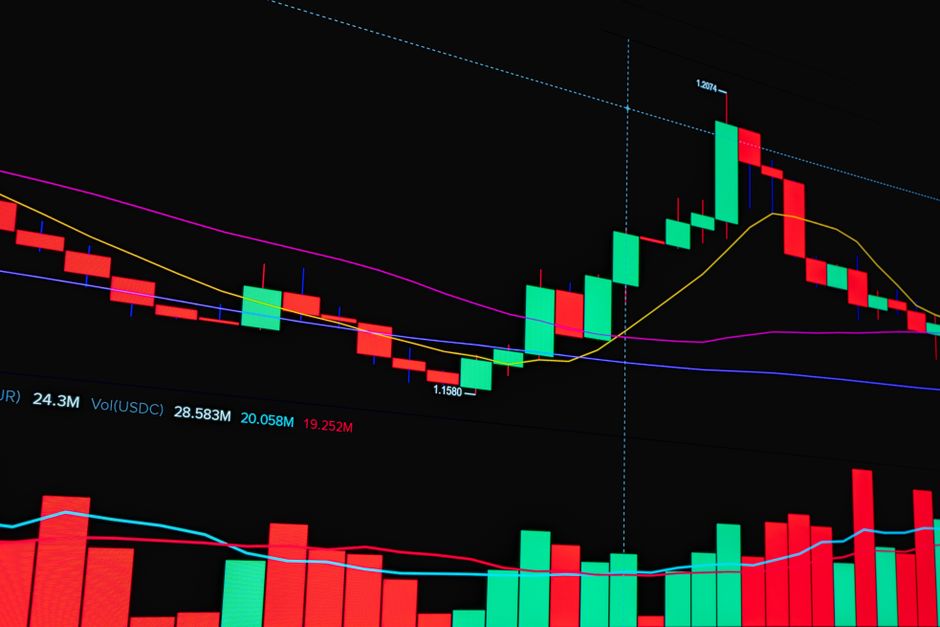
A gap exists when the cash open price sits significantly away from the previous day closing price. The size of this gap relative to the average daily range dictates the probability of a trend day. A small gap often leads to a choppy session high hunt, but a large gap typically indicates institutional repositioning. The premarket volume provides the necessary context for these moves. If the volume during the premarket supports the direction of the gap, the opening range is likely to act as a launchpad rather than a reversal zone.
The Five Minute Range Setup
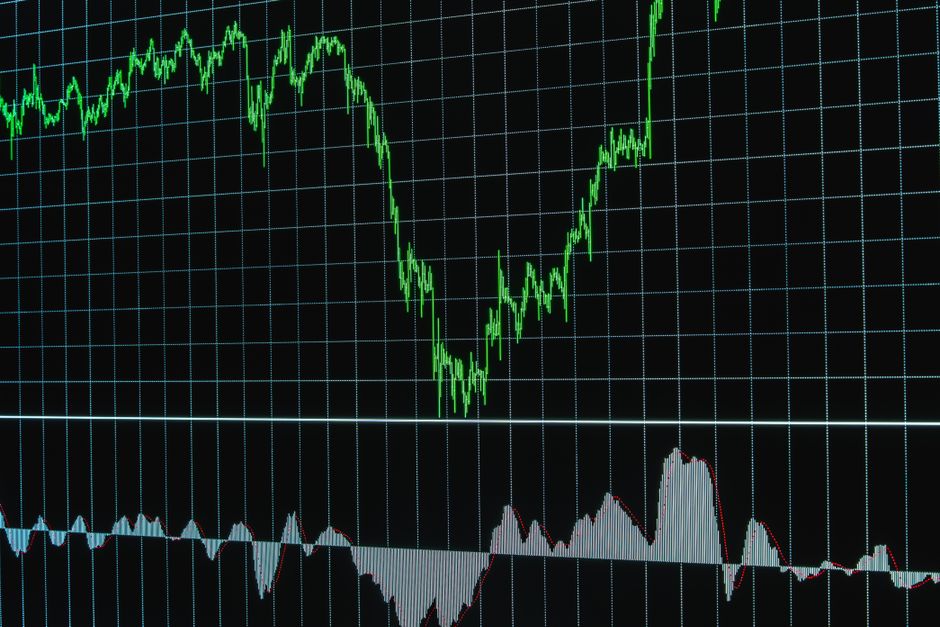
Execution begins by identifying the boundaries of the first five minute range. A gap-and-go move requires the price to hold above the low of the opening range after the initial volatility subsides. When the price breaks the high of the 5 minute candle, the direction is established. A failure to hold the opening range levels often results in a failed gap, where the price drifts back toward the previous day close. The mechanical trigger is a candle close outside the established boundary.
Timeframe Selection and Volatility
Different traders utilize different scales, but the fifteen minute range provides a clearer picture of intraday trend strength. A breakout from a 15 minute range after a significant gap often results in a sustained move through the first hour of trading. Using a larger timeframe like the thirty minute range filters out noise but requires more patience. The relationship between the gap and the chosen timeframe determines the stop placement. A tight stop sits just behind the opening range low, while a wider stop accommodates the volatility seen at the market open.
Volume Confirmation and Trend Persistence
Volume must expand during the opening range breakout to validate the move. Low volume breakouts often lead to exhaustion. Monitoring the volume profile during the first fifteen minutes allows for a calculation of whether the gap is being filled or extended. If the volume remains high as the price moves away from the opening bell, the probability of a trend day increases. The goal is to capture the expansion phase that follows the initial liquidity grab.
Managing the Session High
The session high often forms after the initial momentum slows. Once the price has moved a certain distance from the opening range, the risk to reward ratio shifts. A trend that has already moved several times its opening range volatility requires a different approach to entry. Watching the price action during the first hour helps in determining if the move has enough strength to reach the closing bell without a major retracement.