Opening Range Expansion Factor
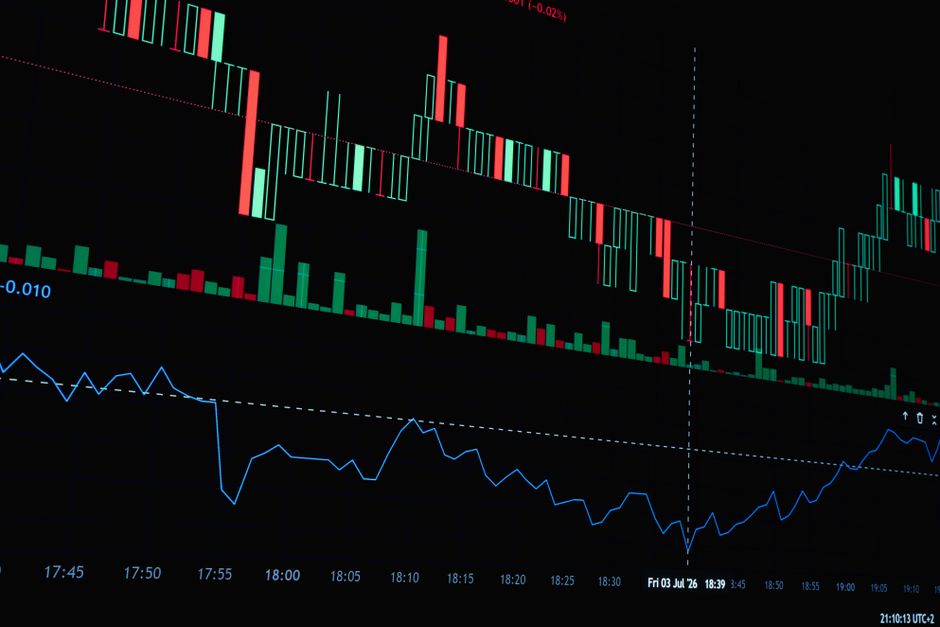
Five dollars is the cost of the data feed. The calculation methods used at orb trading nasdaq brandedvideo differ from standard textbook definitions. Analyzing the opening range breakout requires specific math to determine if the current volatility matches the recent trend. This measurement looks at how the current price action compares to the average volume and range observed in the previous five days.
Calculating the Expansion Factor
The math begins at the market open. First, calculate the high and low of the initial timeframe. If the fifteen minute range is used, subtract the low from the high. This value represents the current range size. Next, aggregate the range sizes from the previous five trading sessions. Divide the sum of those five ranges by five to find the five day average. The expansion factor is the current range divided by that five day average. A result of 1.0 means the current range is exactly average. A result of 2.0 means the current range is twice the size of the recent average.
Applying the Timeframe

Selection of the timeframe changes the output. A 5 minute range provides high sensitivity but often produces noise. A thirty minute range provides a more stable baseline for intraday trends. Using a sixty minute range captures the broader momentum of the first hour. Each selection requires a consistent calculation of the previous five days to maintain accuracy. If a trader uses a 15 minute period today and a 30 minute period tomorrow, the expansion factor becomes incomparable. Consistency in the chosen period is the only way to track expansion over time.
Interpreting the Expansion Ratio
Volatility expansion signals a shift in regime. When the ratio exceeds 2.0, the current session is experiencing abnormal movement relative to the recent past. This often occurs following news events or significant premarket activity. High expansion factors suggest that the opening bell has triggered a directional move that exceeds the standard deviation of the previous week. Low expansion factors, such as 0.5, indicate a compressed session where the price is moving within a tight corridor. Compression often precedes a later breakout during regular trading hours.
Mechanical Execution
Execution depends on the relationship between the expansion factor and the session high. A breakout above the opening range during a high expansion period carries different weight than a breakout during a low expansion period. Large expansion factors suggest the current trend has enough momentum to sustain itself through the midday lull. Conversely, a low expansion factor indicates a lack of conviction. Monitoring the ratio helps identify when the current intraday movement is an outlier. This data point provides a mechanical way to measure volatility without relying on subjective observation.